Views from the microscope.
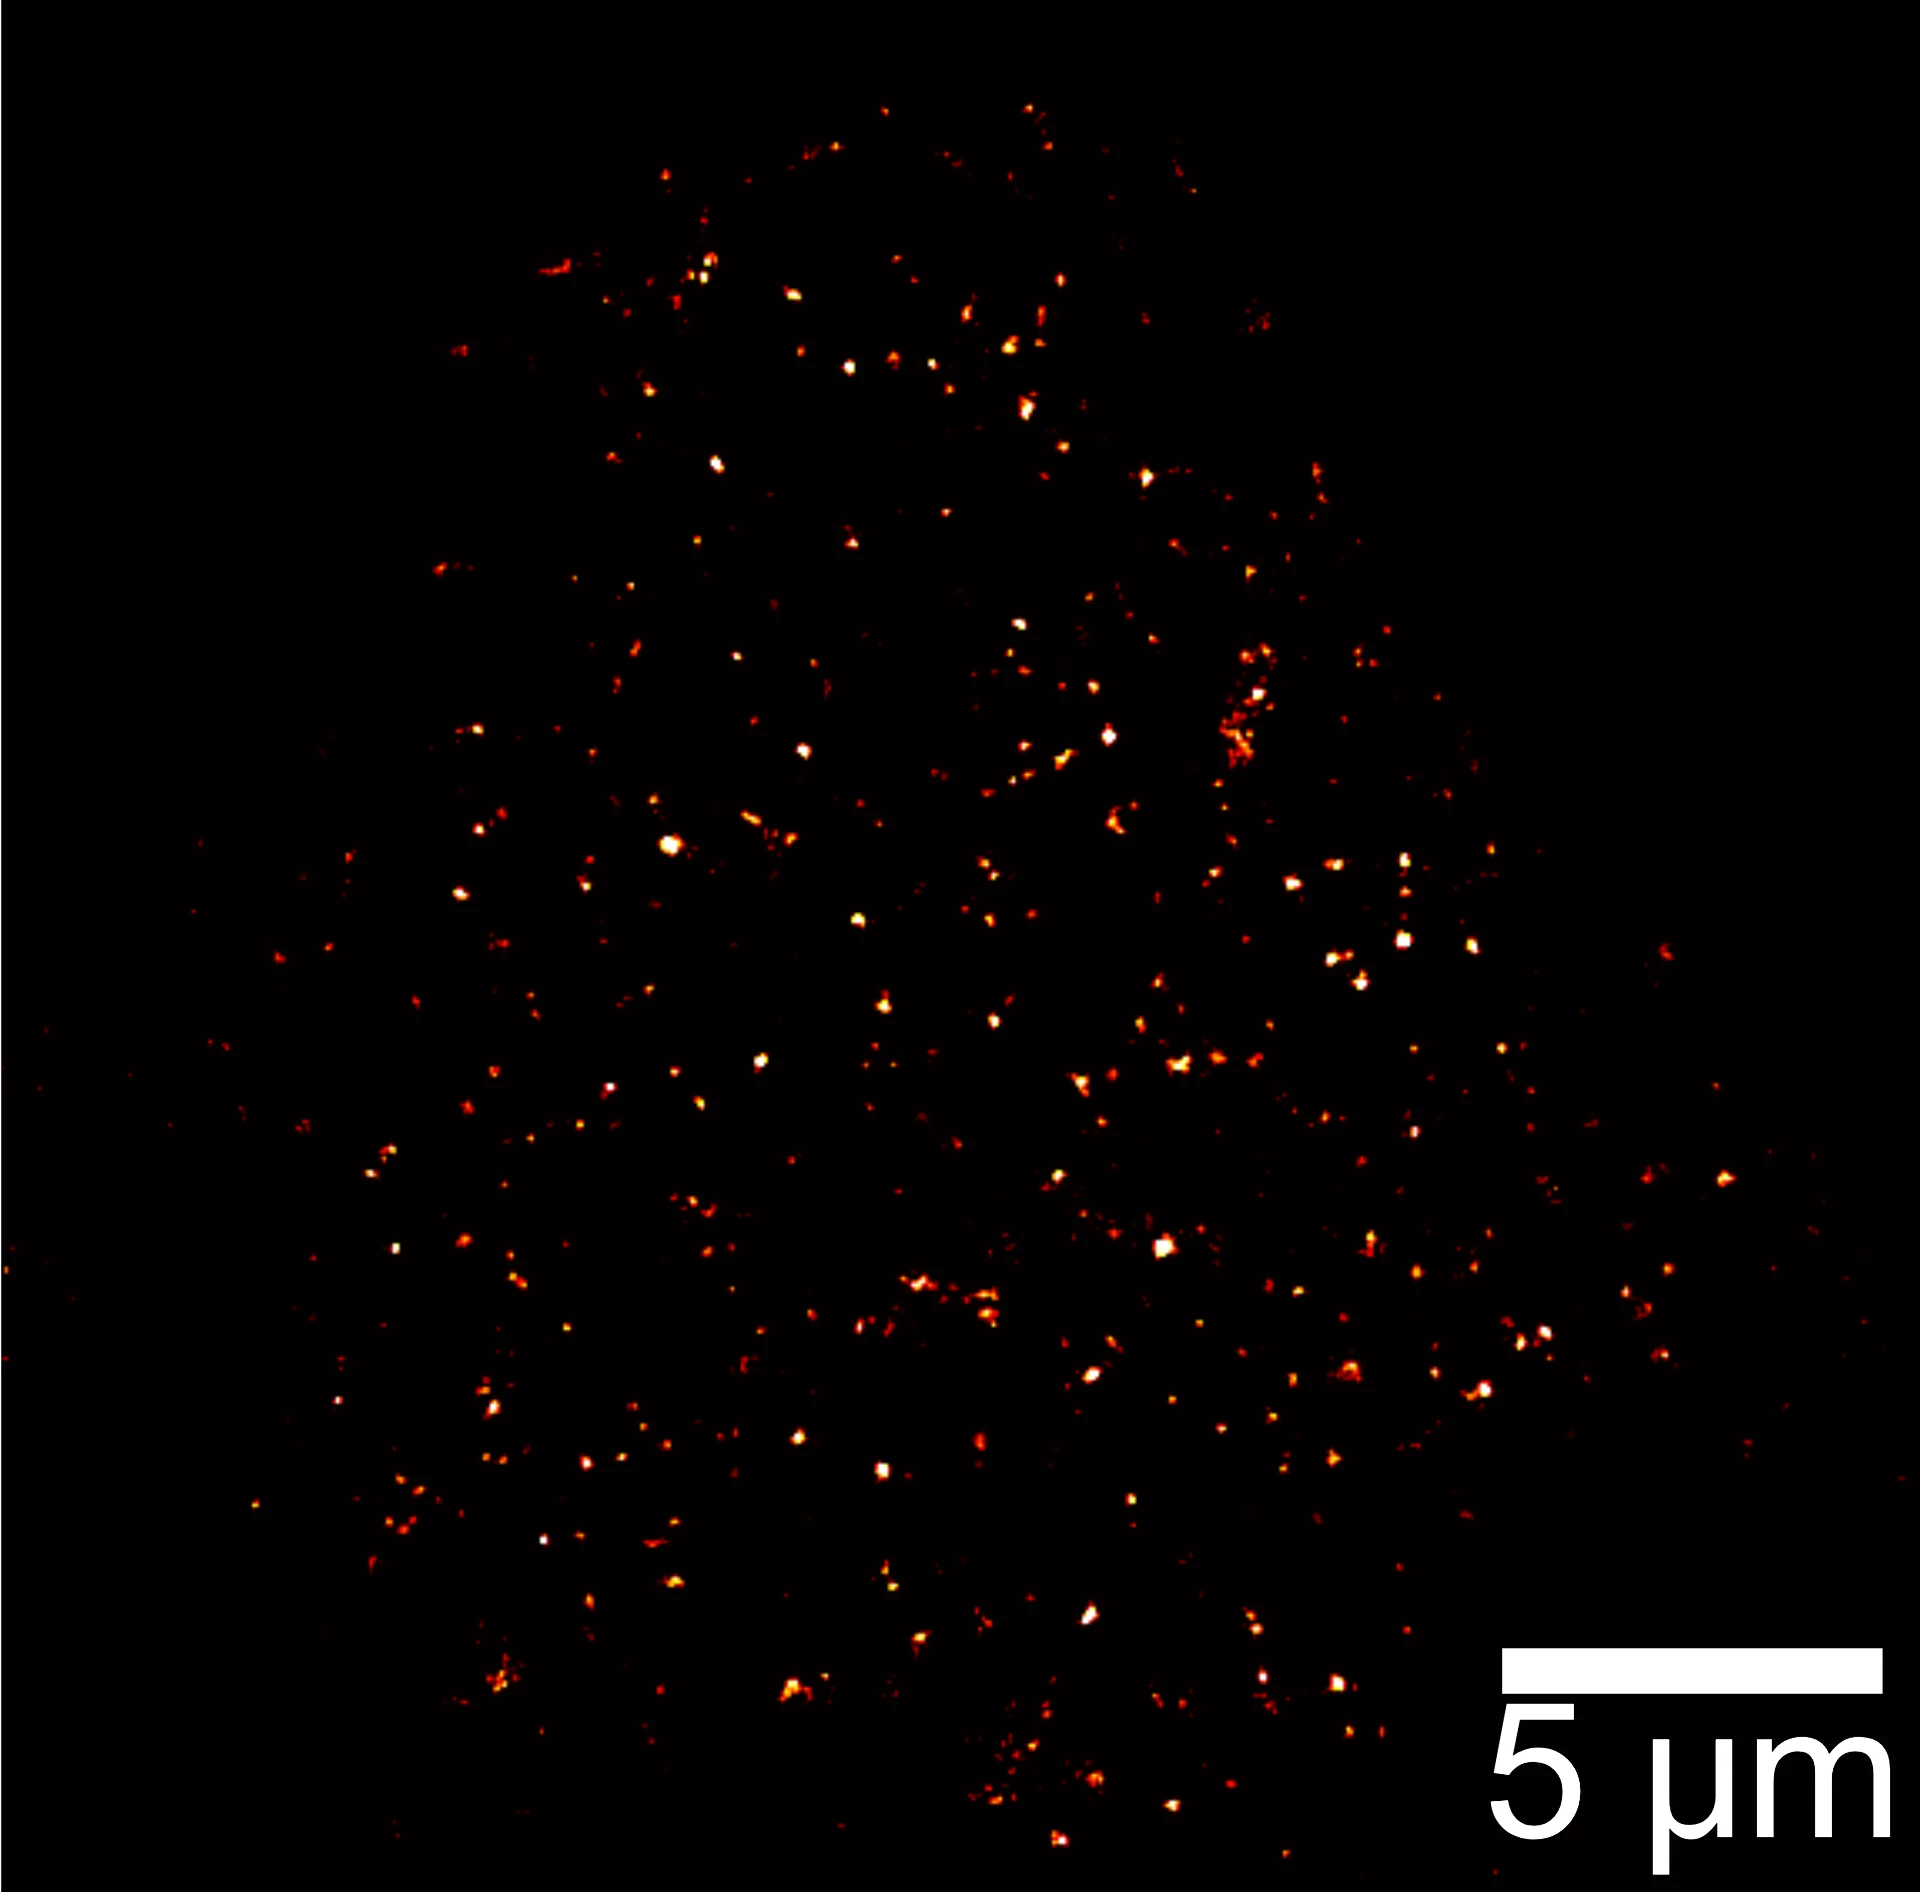
2D TDI-DNA-PAINT
10 minutes acquisition to generate a CD20 localization map in the basal membrane of B cells
Lattice light-sheet TDI-DNA-PAINT
Whole-cell volume CD20 map at molecular resolution
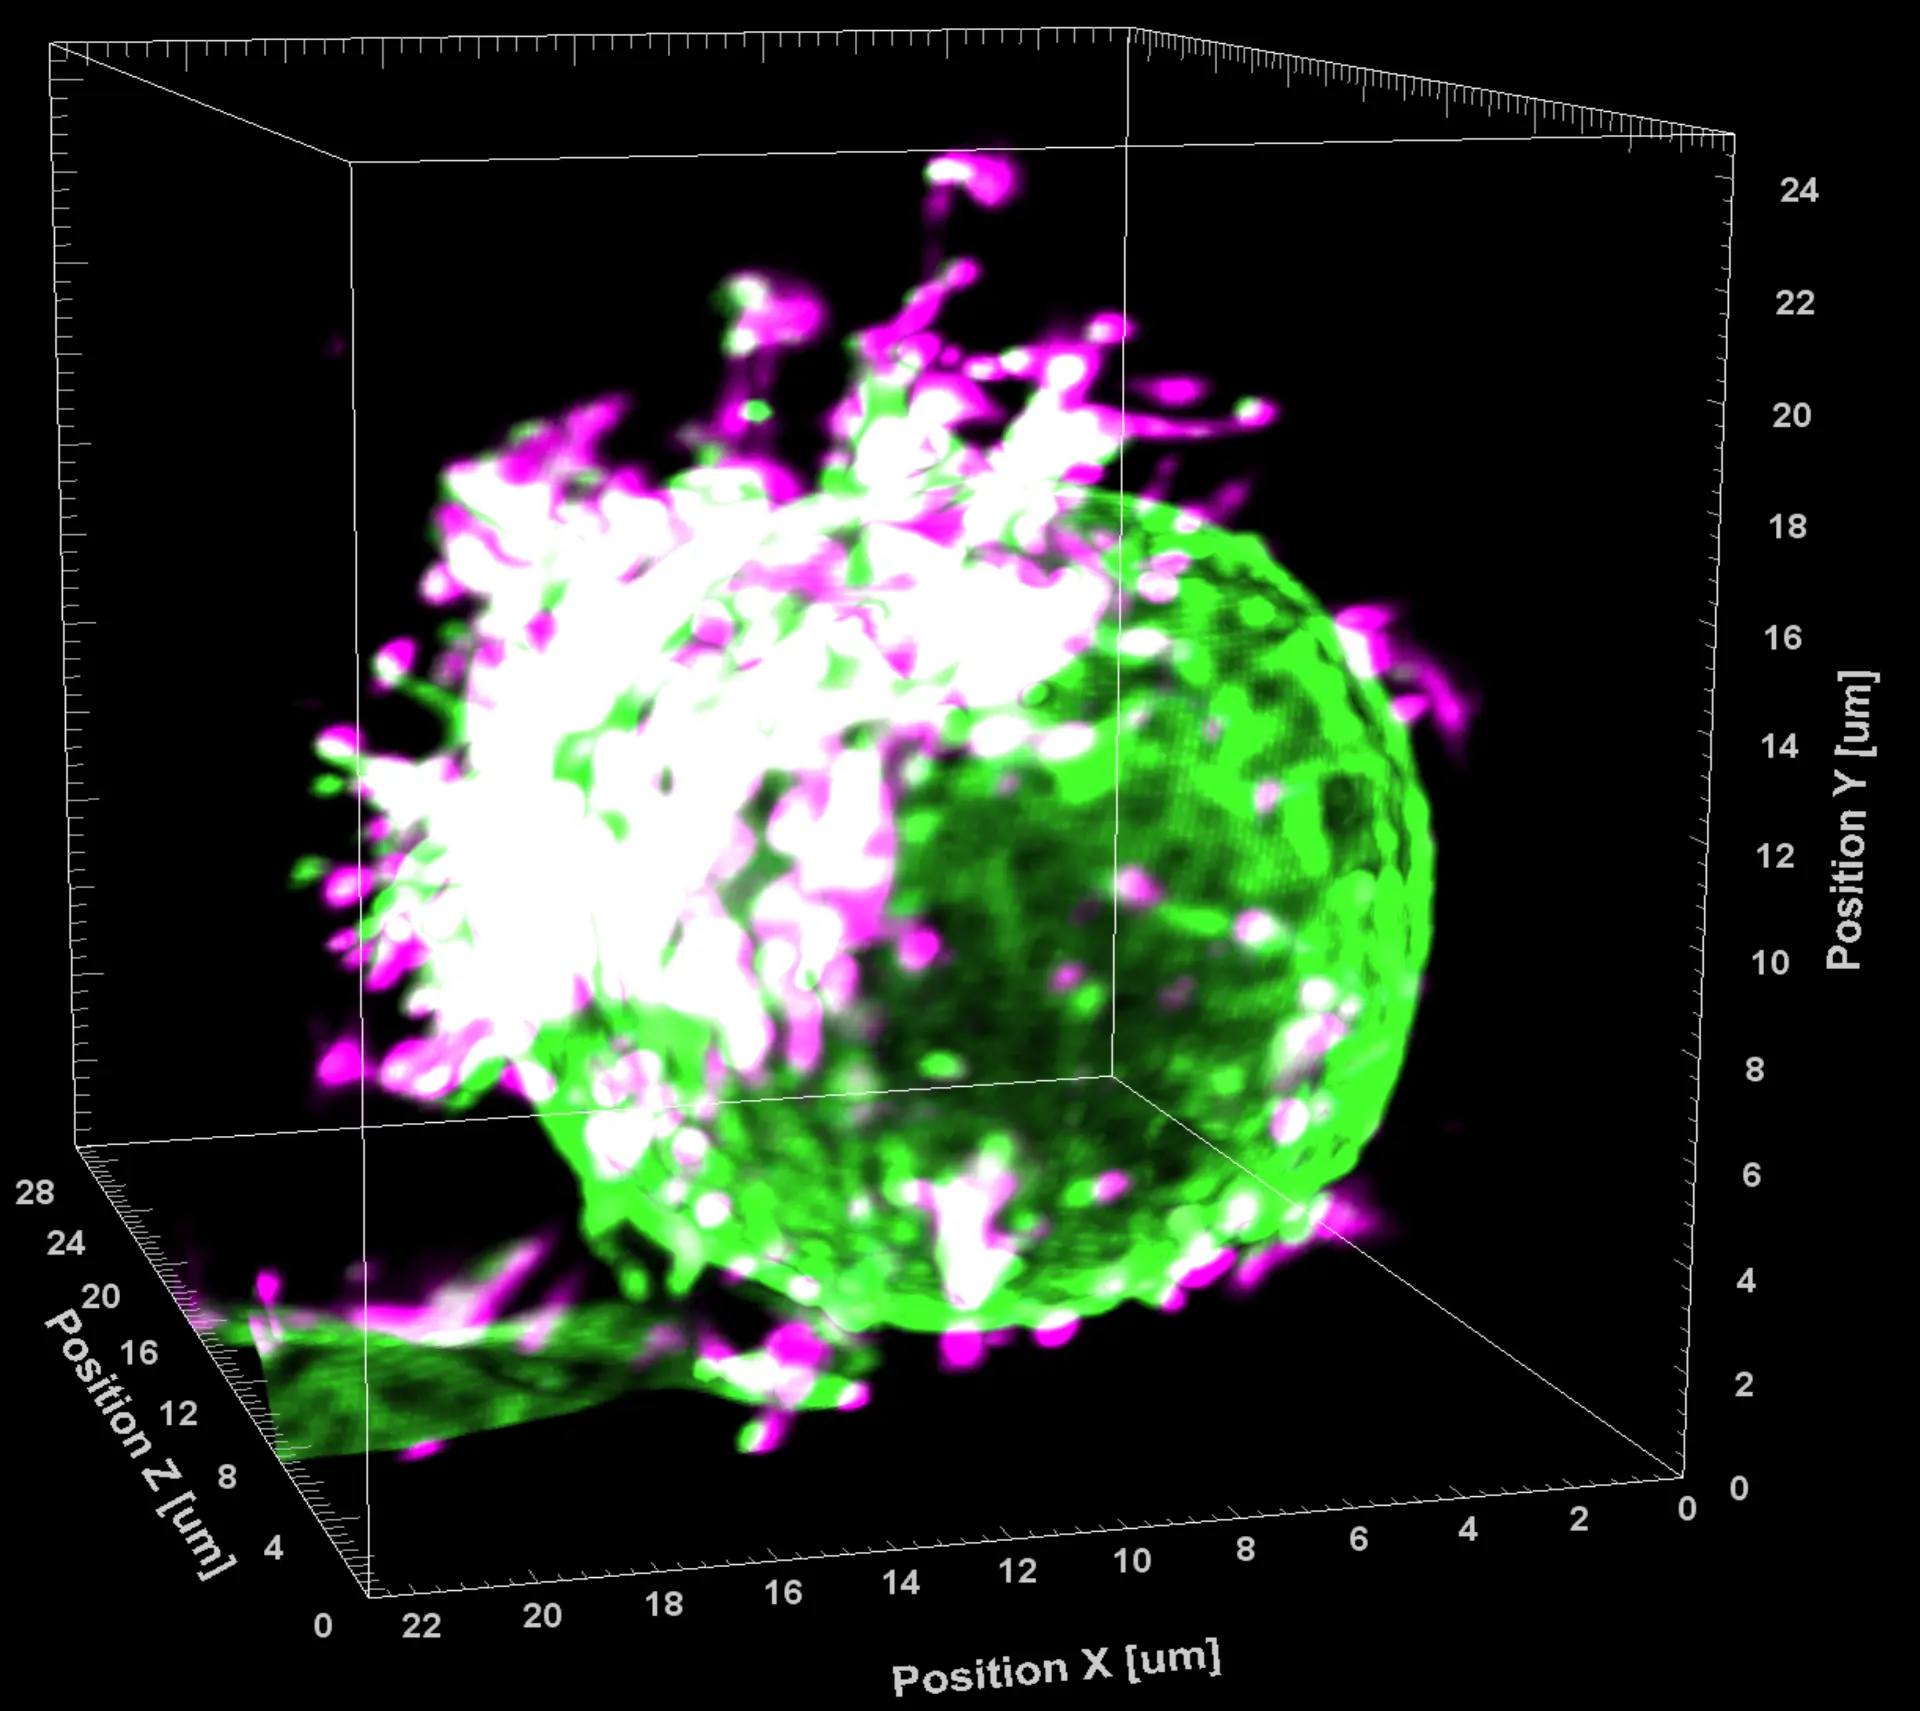
Therapeutic antibody engagement
Two color LLS imaging of a 'hedgehog' shaped B cell showing polarization of CD20 by Rituximab (magenta). CD45 is visualized in green
Real time binding of Ofatumumab to CD20
Real time binding of Ofatumumab to CD20
Yellow: F-actin, Magenta: Ofatumumab
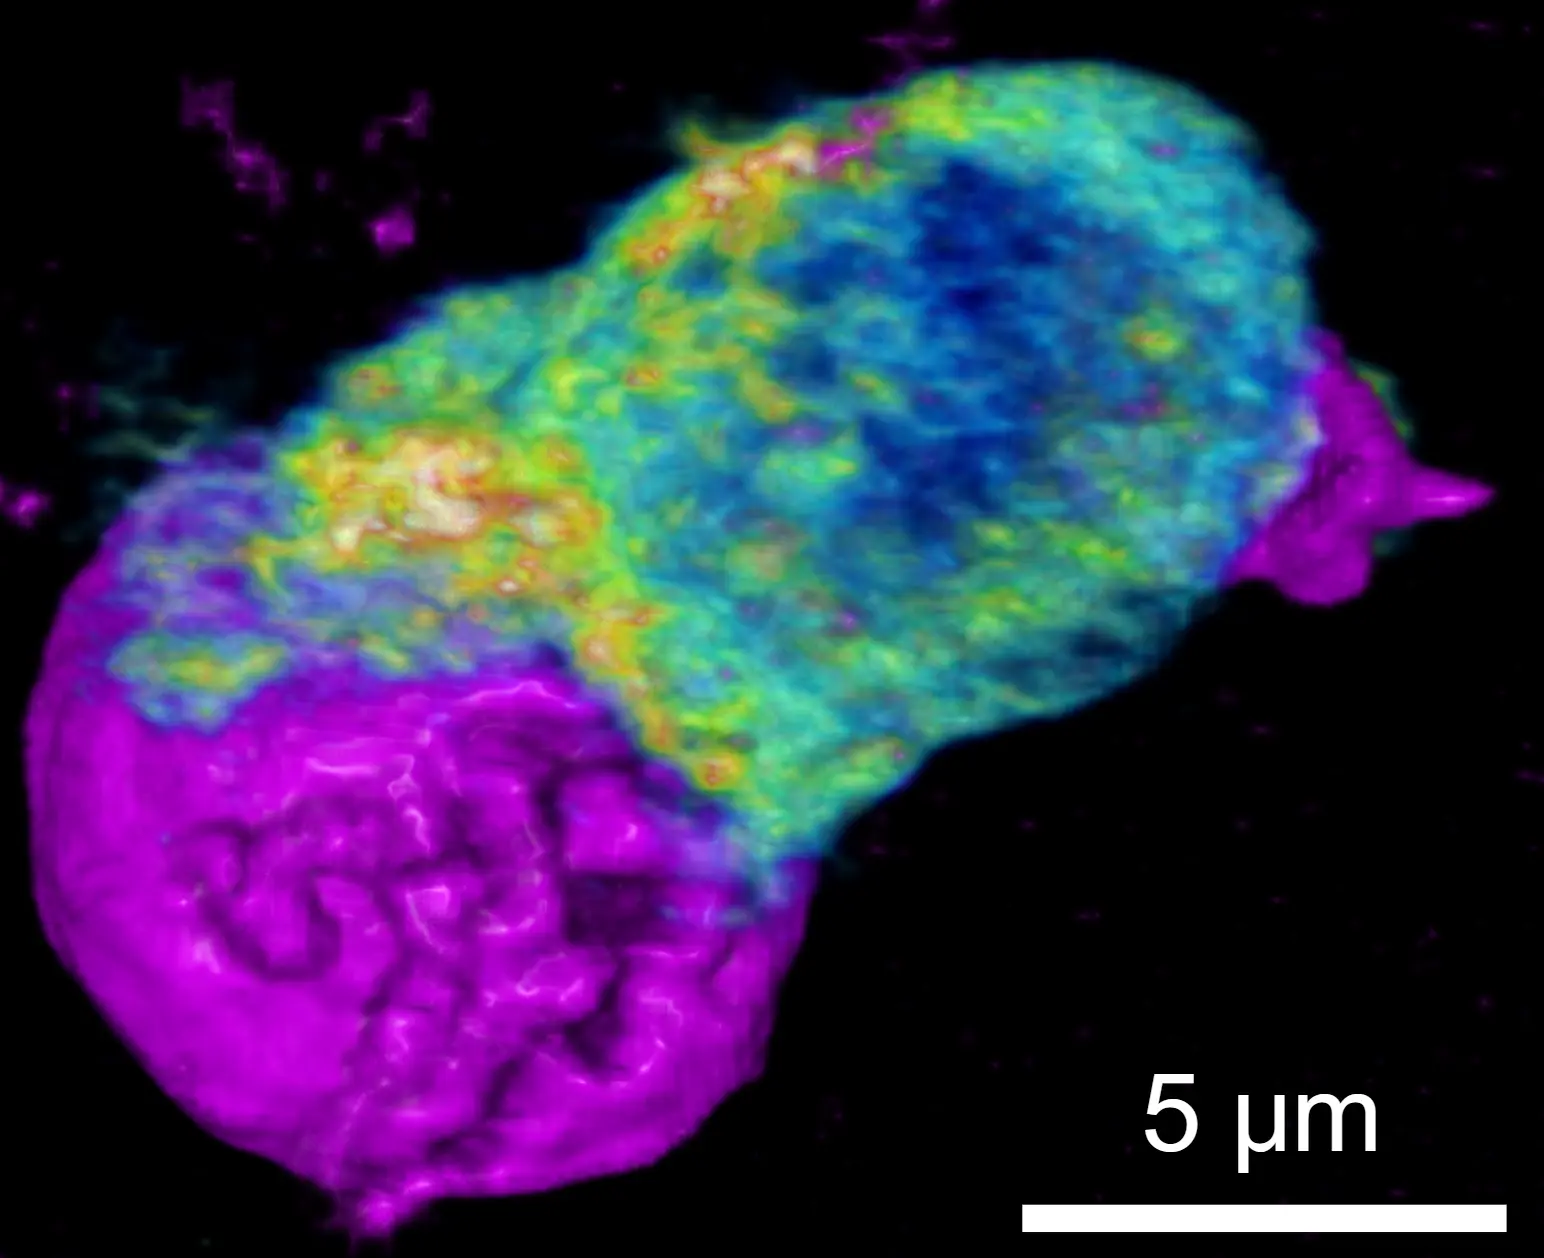
Immune synapse
Contact architecture between effector and target cell
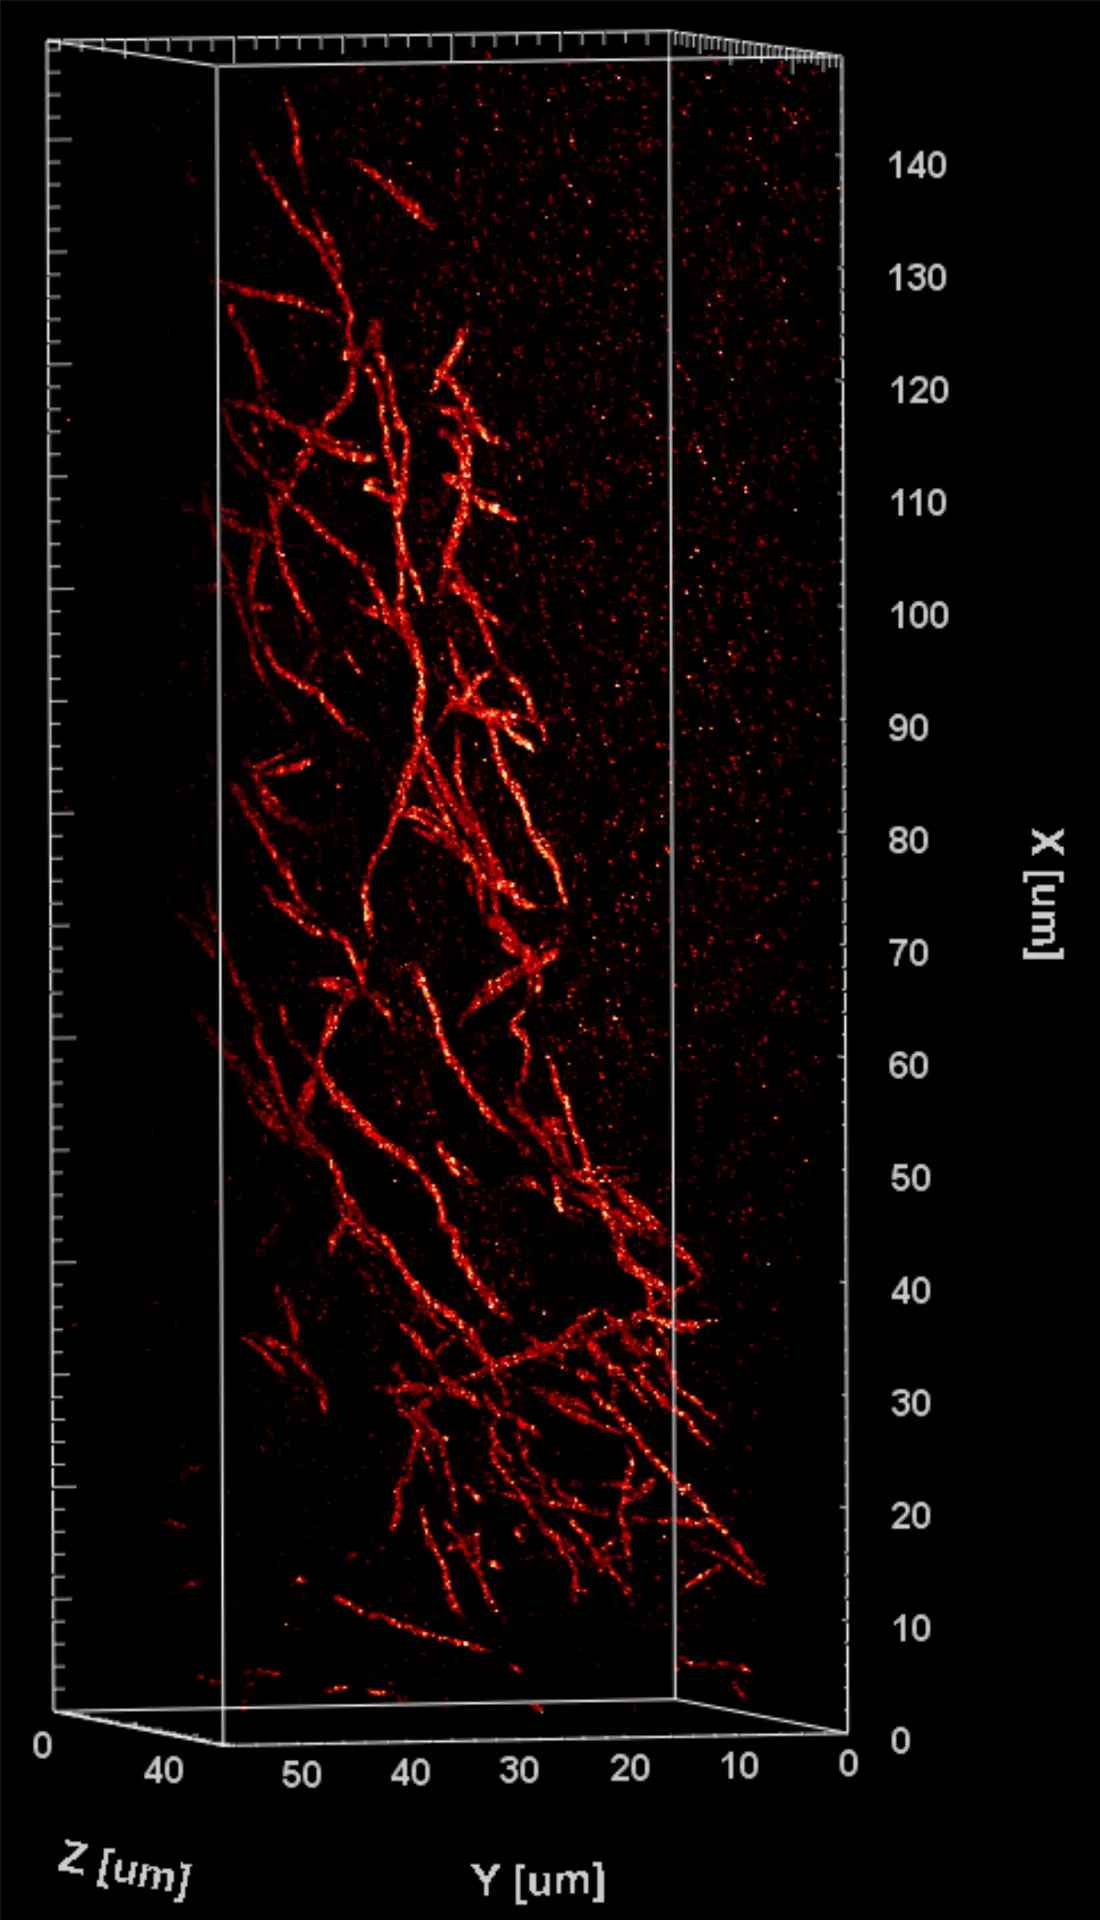
ExM TDI-DNA-PAINT
TDI DNA PAINT imaging of tubulin inside a 8x expanded gel
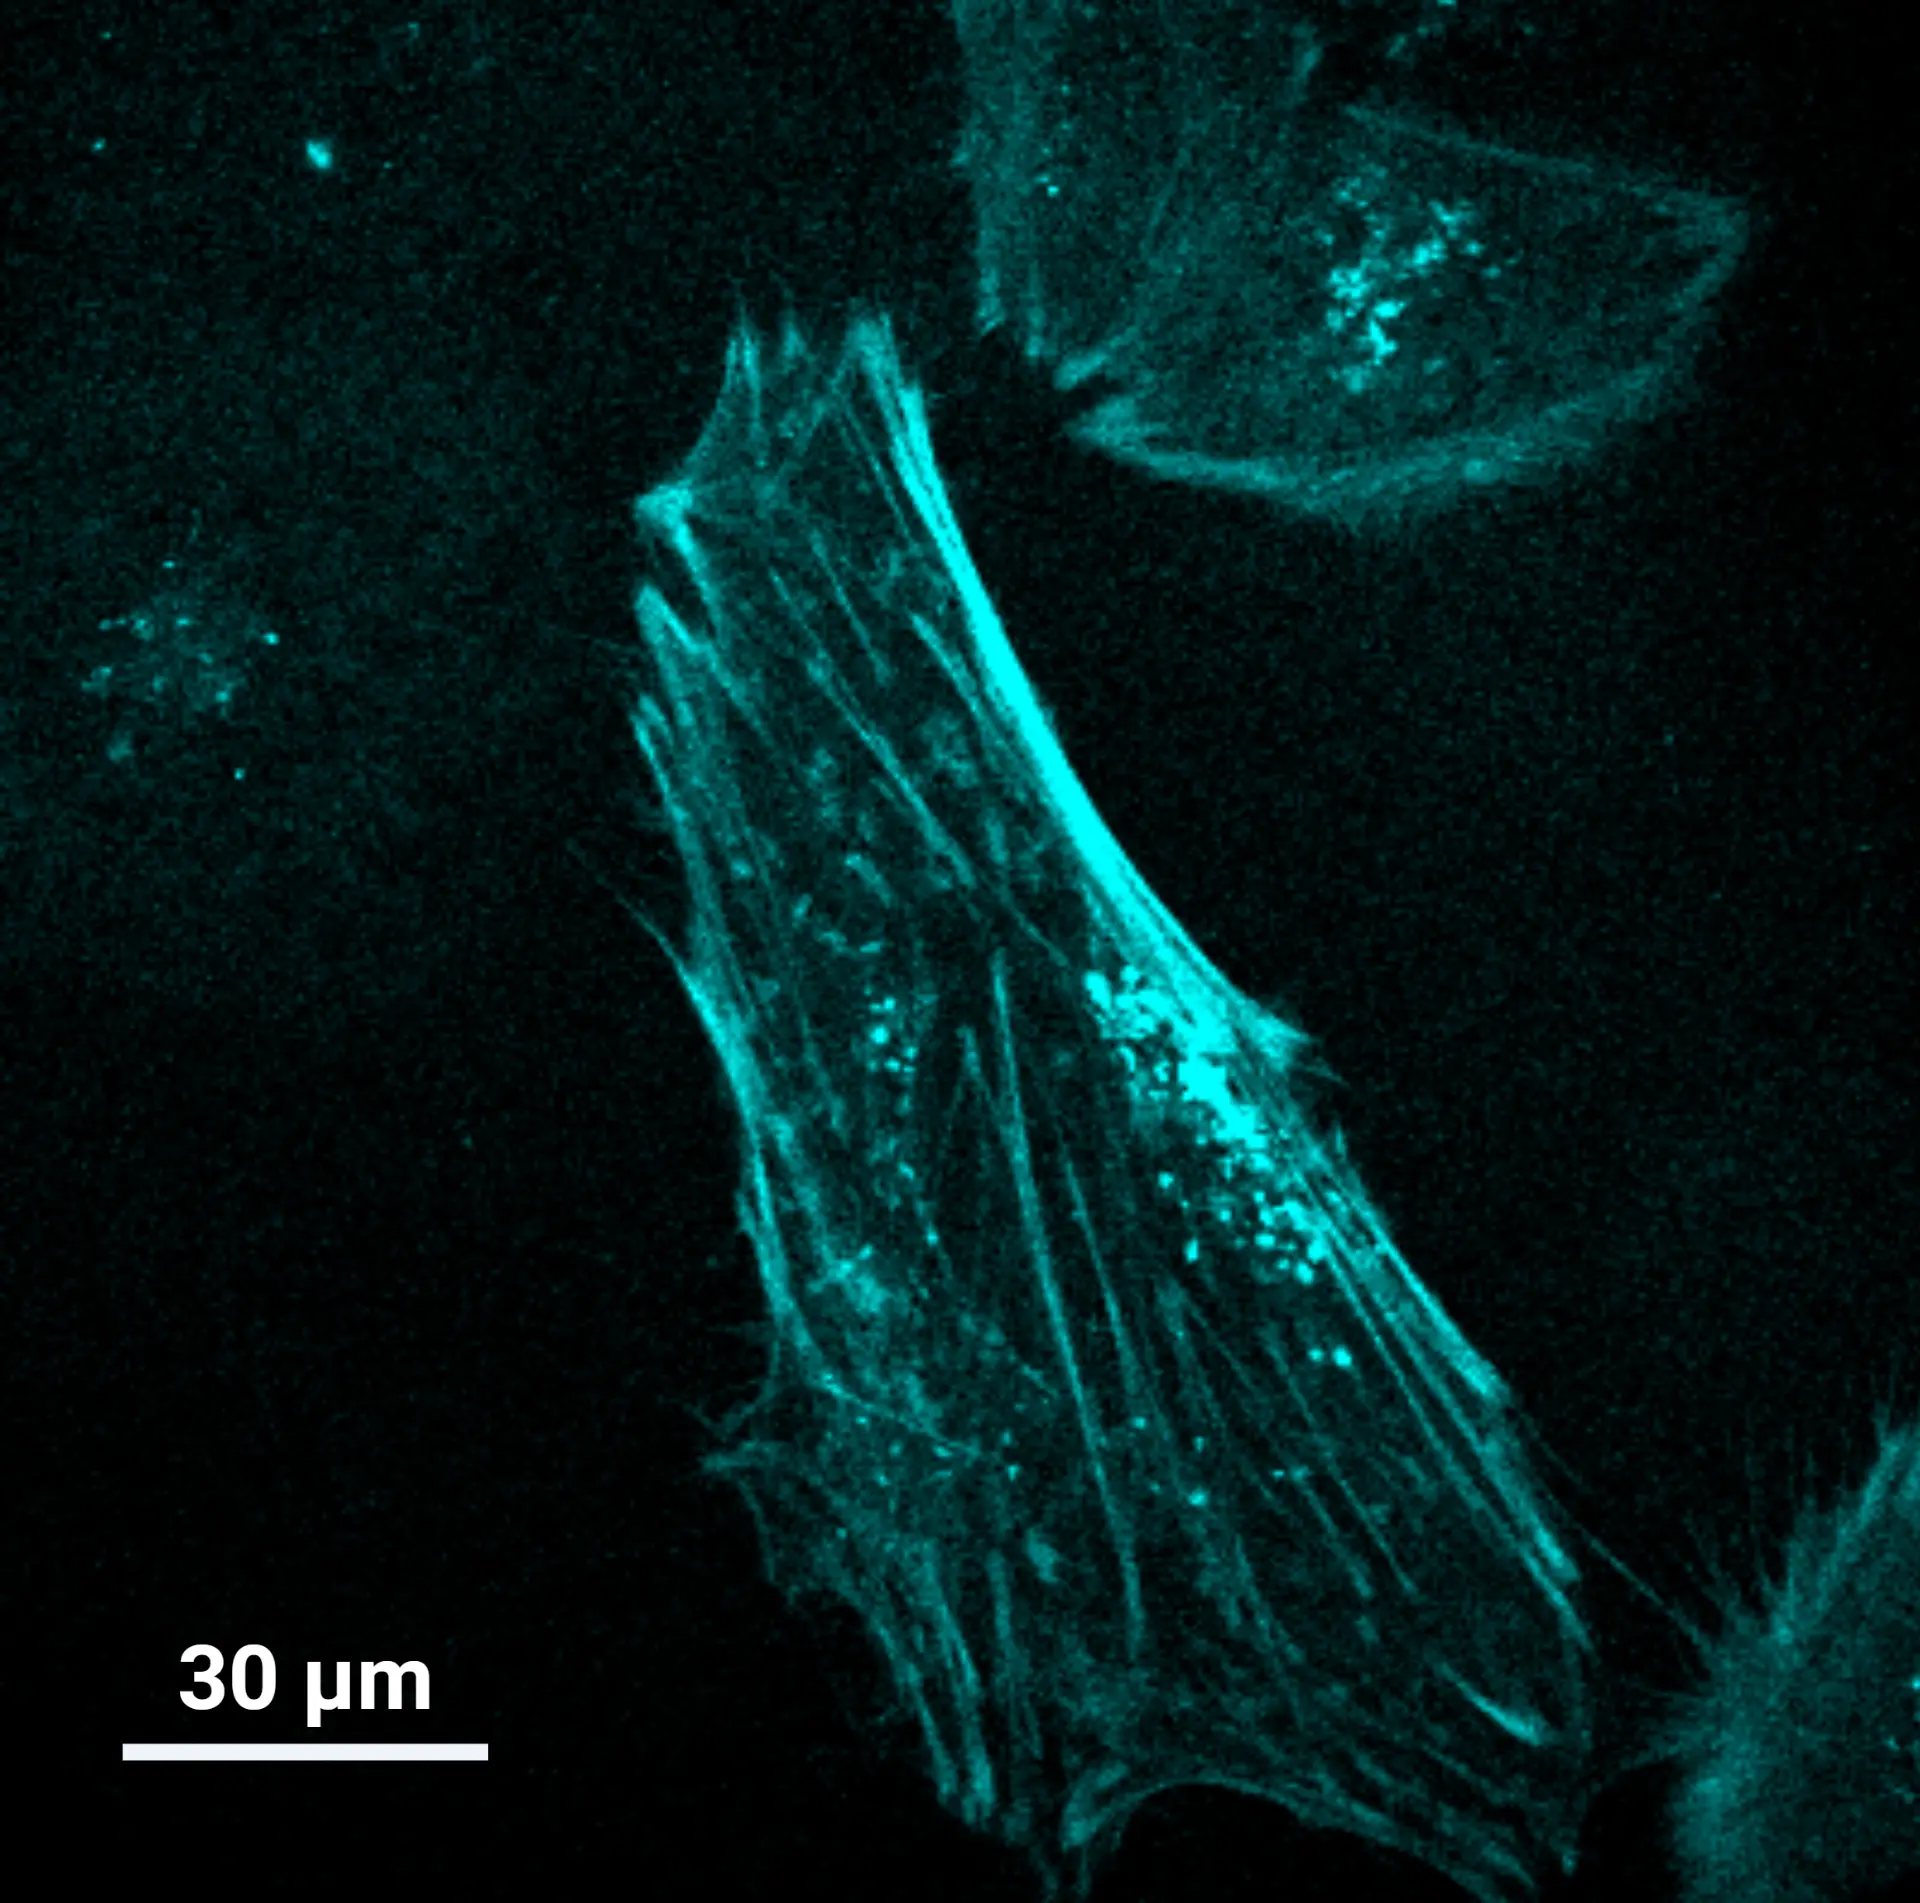
Molecular force sensor imaging
Cytoskeletal tension reporter in live cells
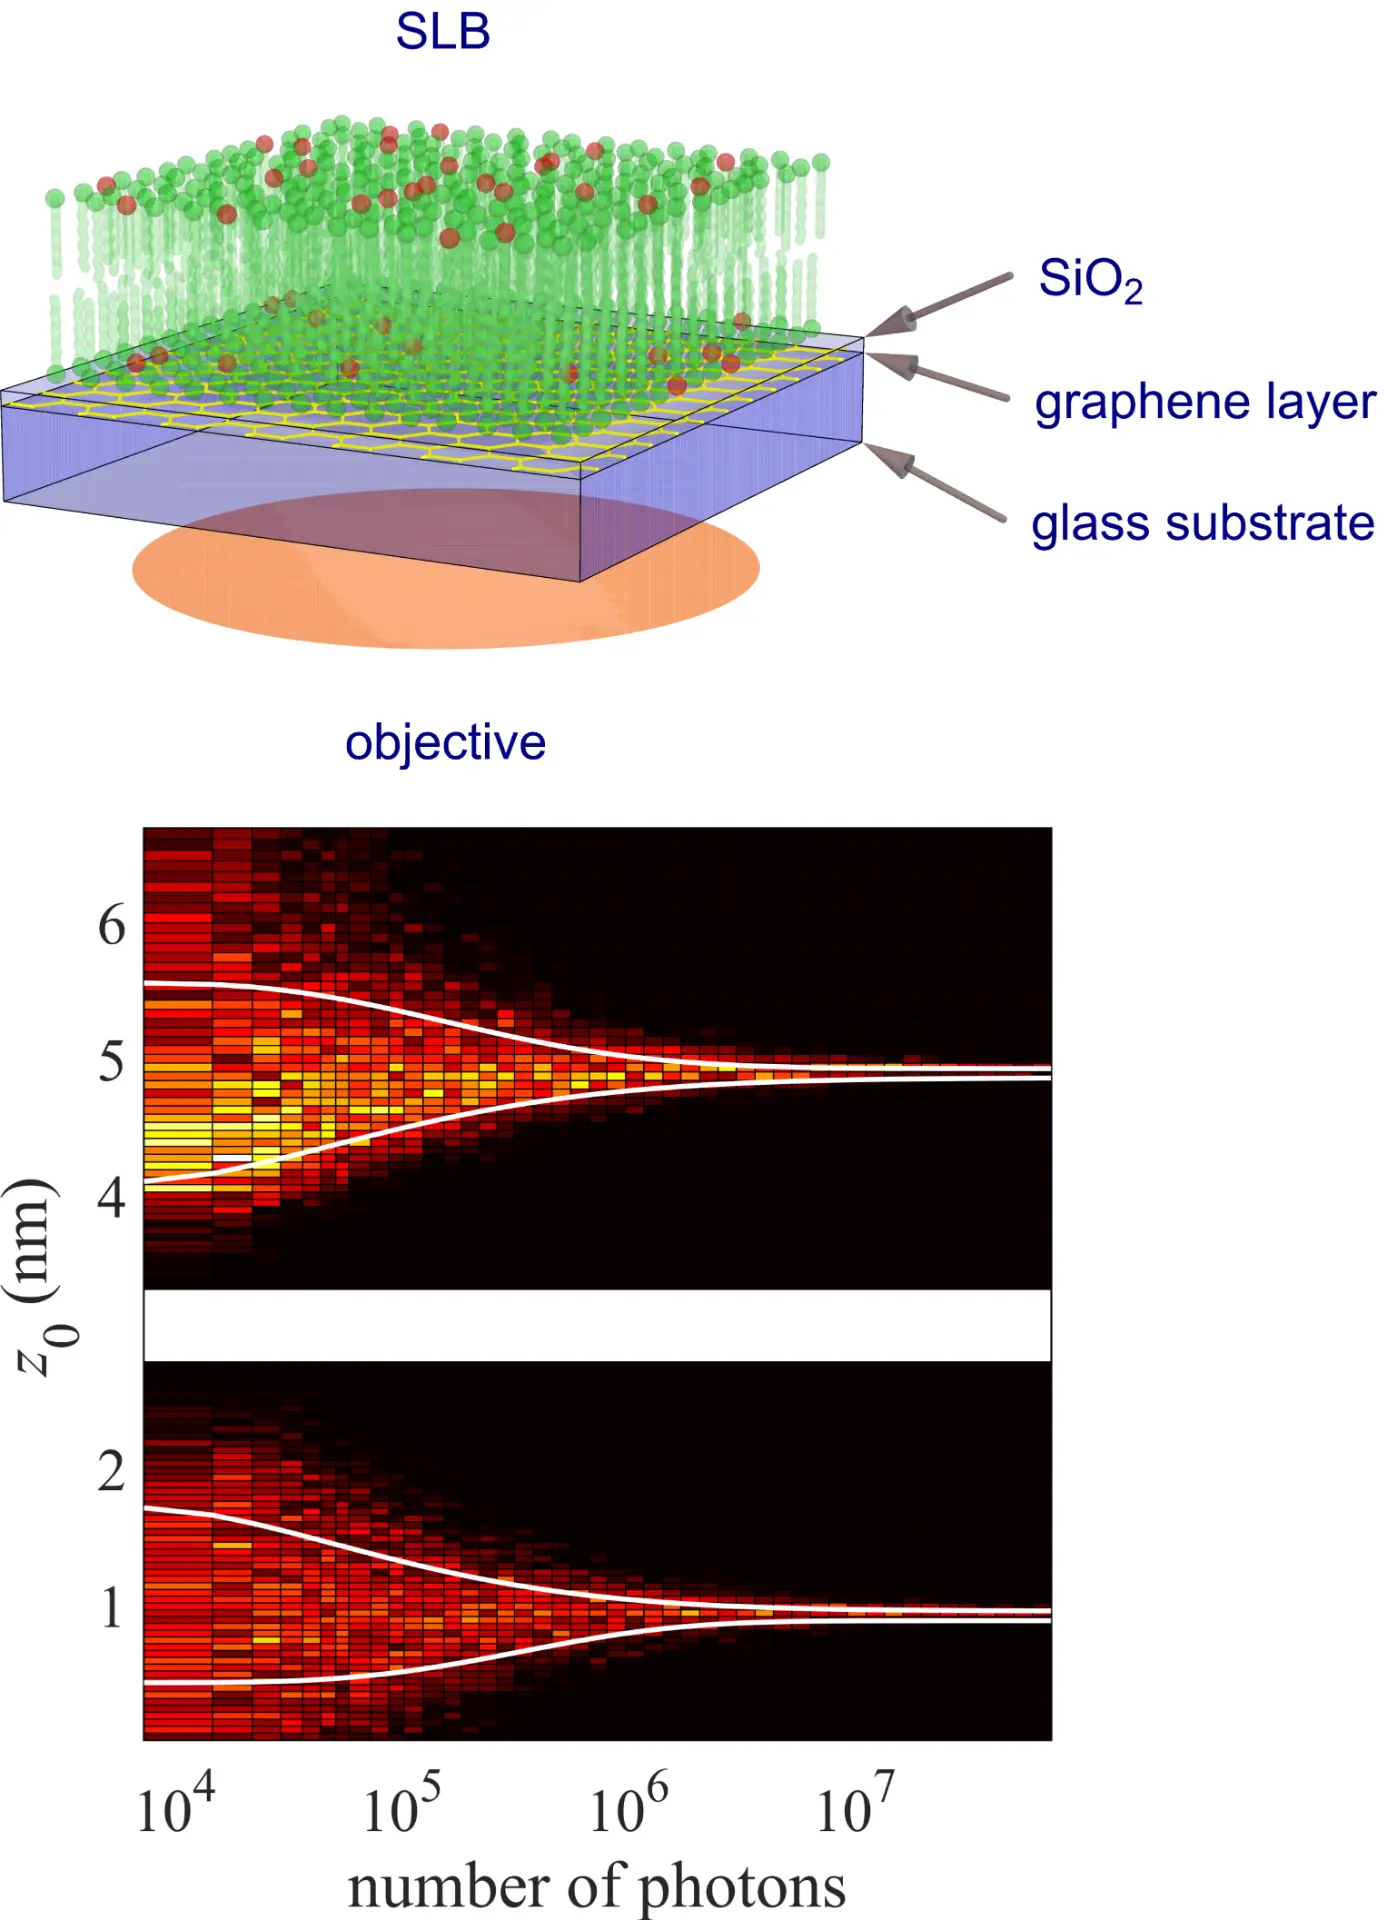
Graphene-induced energy transfer (GIET)
Ångström precision axial localization with GIET, discerning fluorophores in individual leaflets of a bilayered membrane
Live-cell MIET imaging
Membrane dynamics of Dictyostelium discoideum
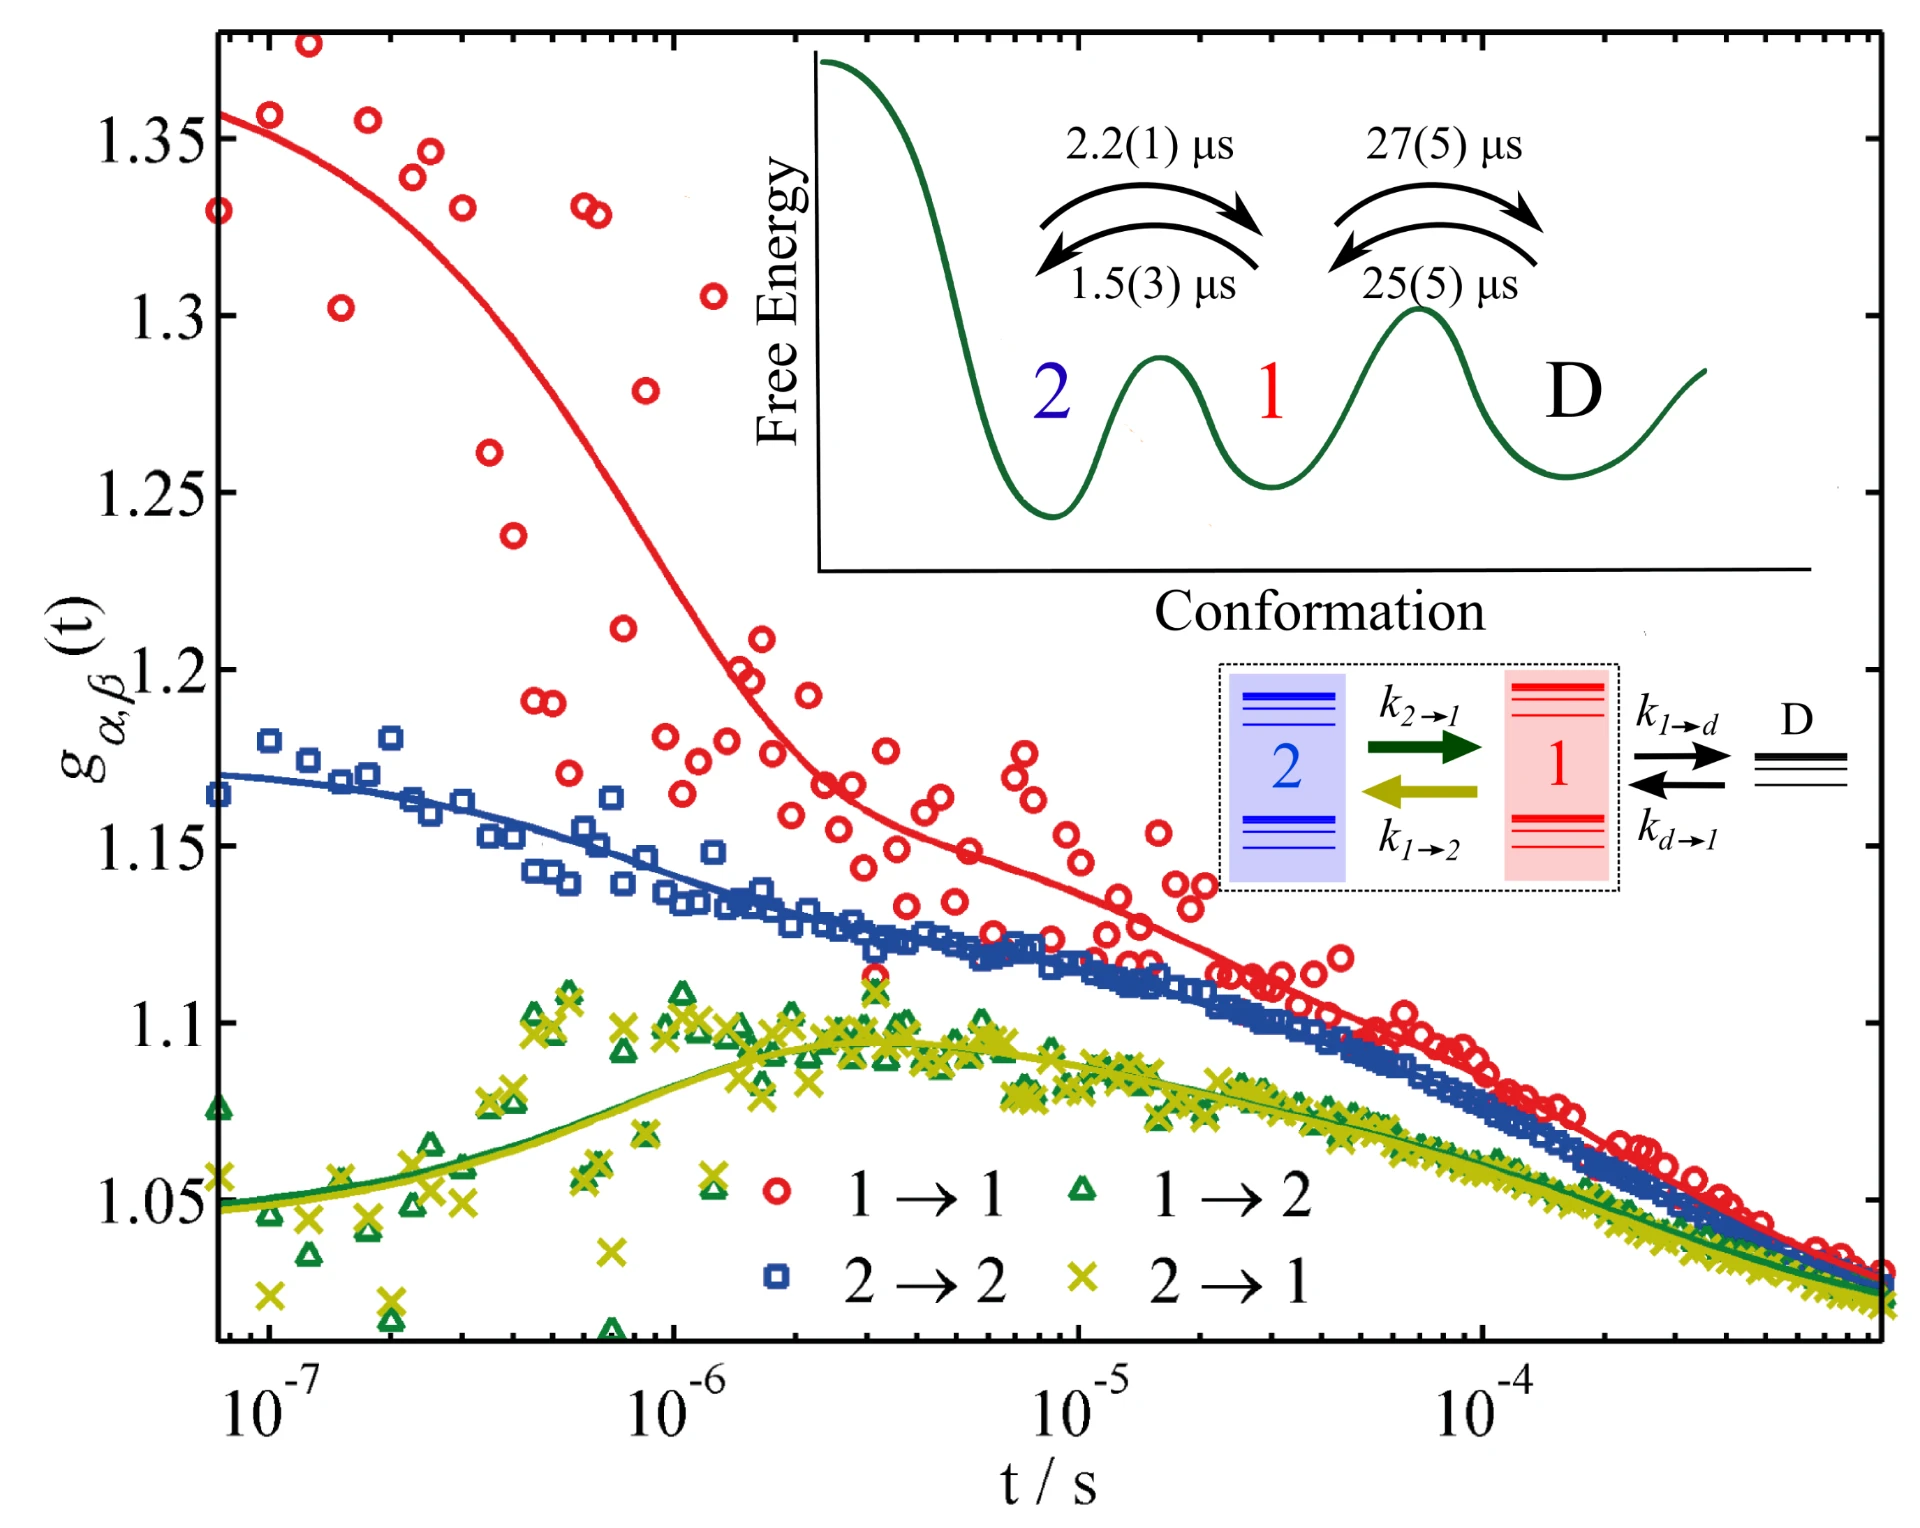
Fluorescence lifetime correlation spectroscopy (FLCS)
Resolving microsecond switching dynamics between two emission states of EGFP using FLCS